If you’ve used Insight for a while, there’s a good chance that you knew and loved the “Key Groups Summary” report. This was a super simple report, with just two selections and a button, which got you to your key data for your key groups really fast. So why did we decide to remove it?!
While the Key Groups Summary report was loved for its simplicity, we received many requests over the years for it to offer more flexibility. As schools increasingly move away from levels-style, linear approaches to assessment, these fixed reports — that work best in the context of prescribed assessment philosophies — have become less useful.
We’ve since introduced the more flexible Headlines report, which can be customised to your specific needs and offers more powerful features (such as the option to show the percentage of pupils making expected progress, as defined by you; the option to see multiple subjects in one report; and the flexibility to view multiple terms’ data together). We’ve also given the Tables page an overhaul, and both are capable of getting you to your key data and fast.
Headlines
At Cohorts > Headlines, you’ll find our high-level reporting tool. You can do a lot with this report, and it’s fair to say it can be a little daunting at first!
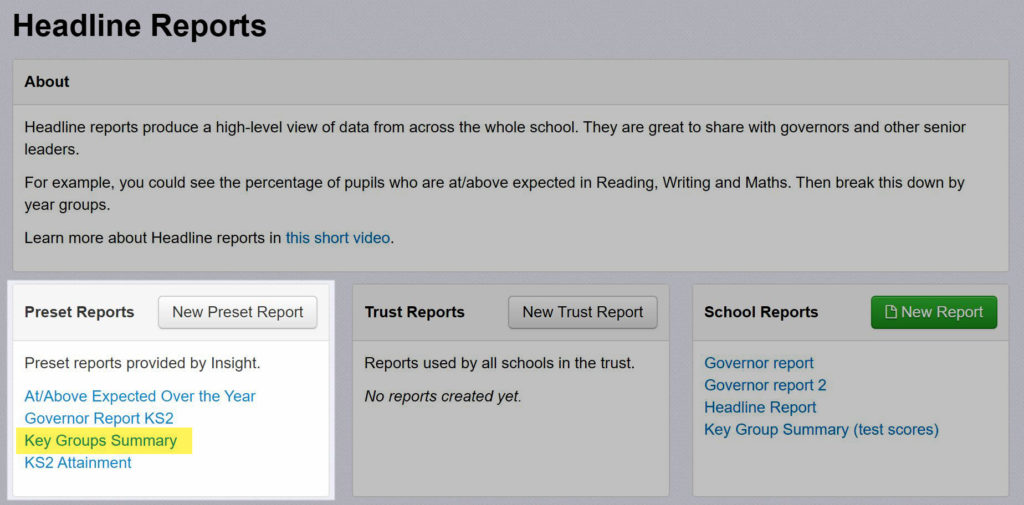
To help you get started, we have a Key Groups Summary report ready under the Preset Reports:
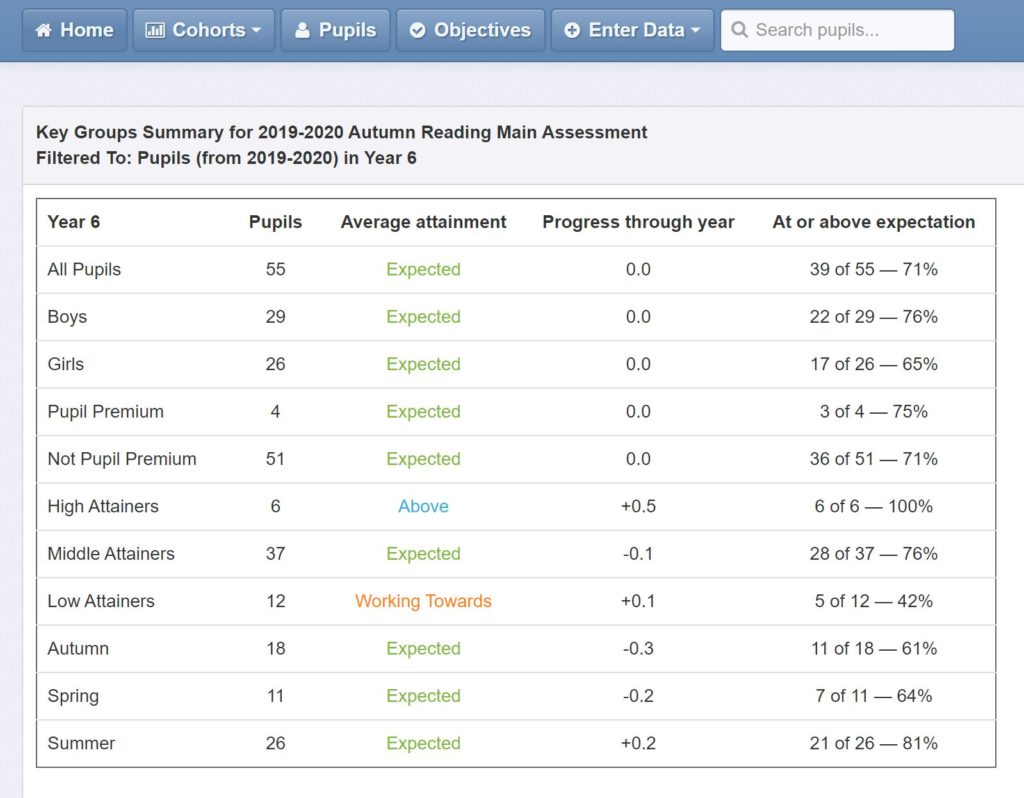
The default report shows the % of pupils on track in Reading, Writing, Maths, and RWM Combined, for last summer to the current term. Your entire school is pulled in, grouped into years and key groups:
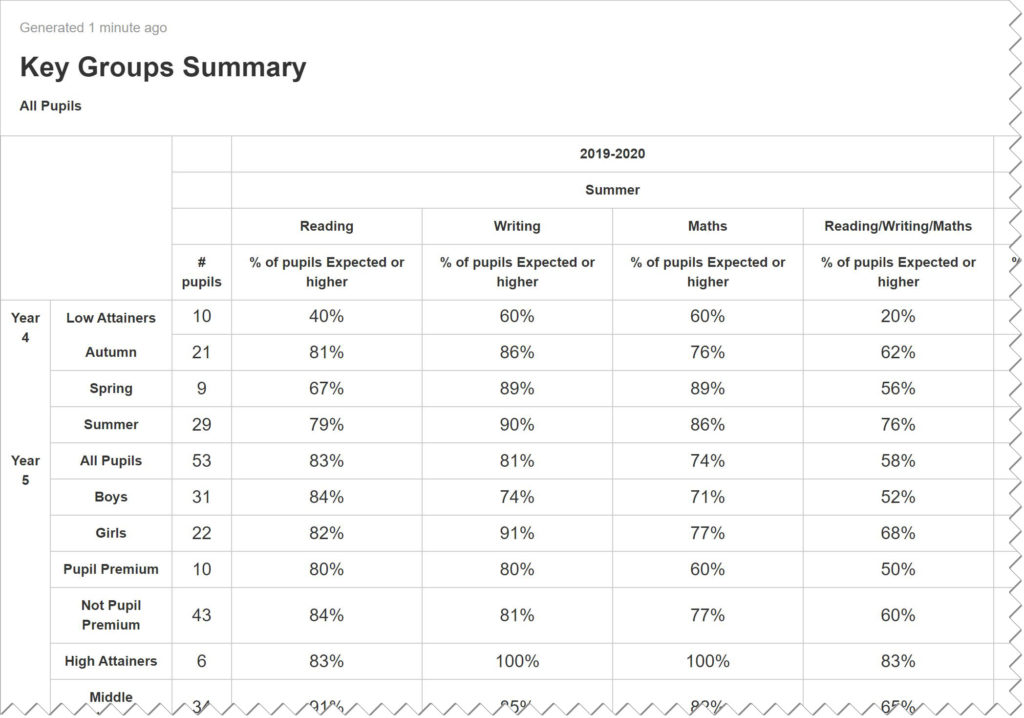
Depending on what information you want to see, you can edit the report as you see fit and save it into your School Reports. You might choose just to show Y1-6, or to add progress information, more visual attainment analysis, or average attainment figures.
If you’d like to learn more about Headline reports, check out this video.
Tables
Tables offer another way of pulling together key data for key groups. There’s less flexibility here, but as a result reports are easier to set up, and they’re more dynamic too. If you want a summary of one cohort’s key data for a single term, with the option to quickly switch which year group and term you’re looking at, or you want to see pupil level results to further investigate the data, Tables are your friend.
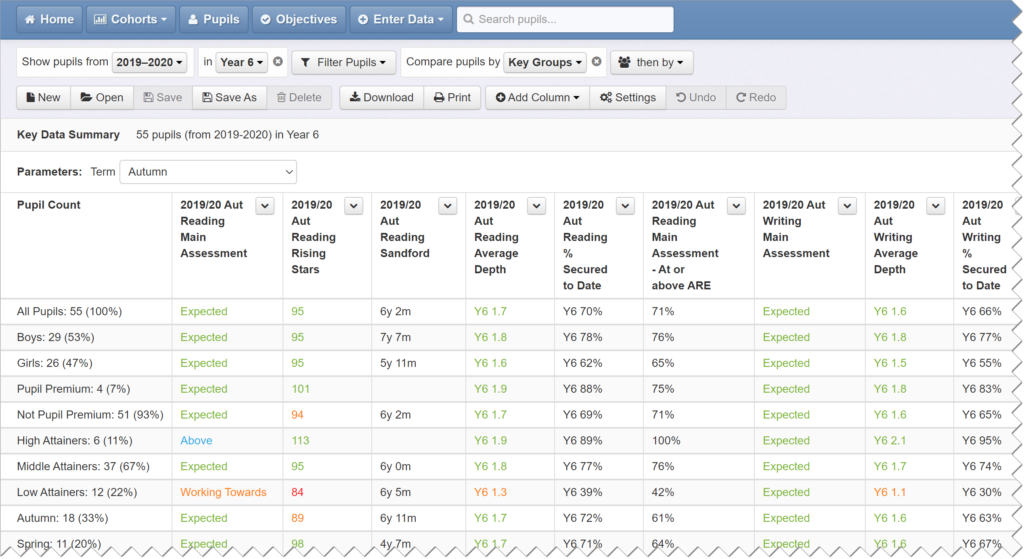
Again, we’ve set up a default report to help you get started. At Cohorts > Tables, click Open and choose Key Data Summary from the presets list:
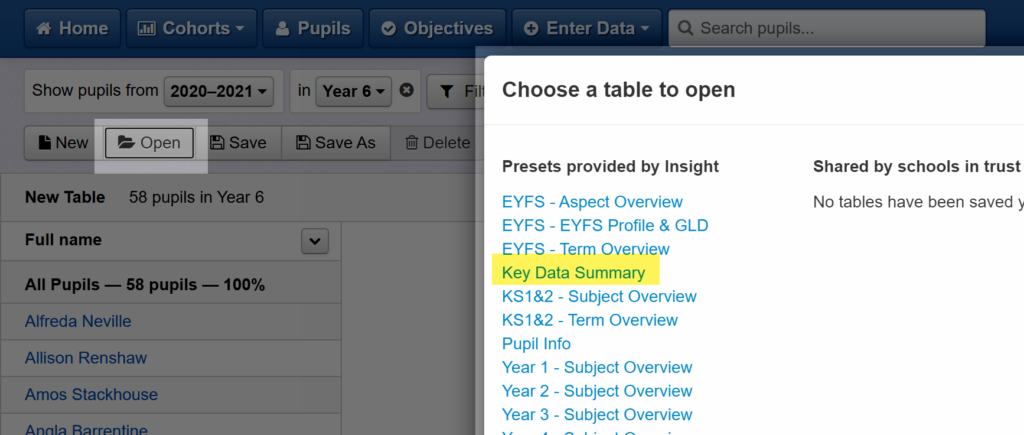
By default, this Table report will show you a summary of all your data for Reading, Writing and Maths, and the % of pupils on track in each subject, and for RWM combined, for the term selected. You can select and change your cohort of pupils using the toolbar at the top, and use the dropdown in the table to change the term.
To be really useful, you’ll need to use the Group Pupils button to group your cohort. Below, I’ve got Year 6 selected, and I’ve grouped them by Key Groups. But you could also get a higher-level school summary by choosing to view your whole school, grouped by Year Group; or if you’re looking at reception, you might want to group by Term of Birth.
Our guide on using pupil filters and groups talks through using that pupil toolbar in more detail if you’re not sure where to start.
Of course you can also customise the columns of data pulled into the table as well, and save your own custom copy into your school reports. Or read our walkthrough on building your own Key Group Summary report from scratch.
Getting Help
We know how tricky and frustrating it can be when reports change, so please don’t hesitate to get in touch for help. The support team are on hand to help create and edit reports, and you can also book free training if you’d like to explore these and other reports in more detail.