
Meet Your New Favourite Insight Report
November 10, 2026
We don’t like to choose favourites, but if you asked our team which is their favourite Insight report, Tables would be up there. Whilst it may not sound like the fanciest report in Insight, its flexibility makes it useful for everything from exploring individual pupil progress to preparing summaries for governors. Let's take a closer look.
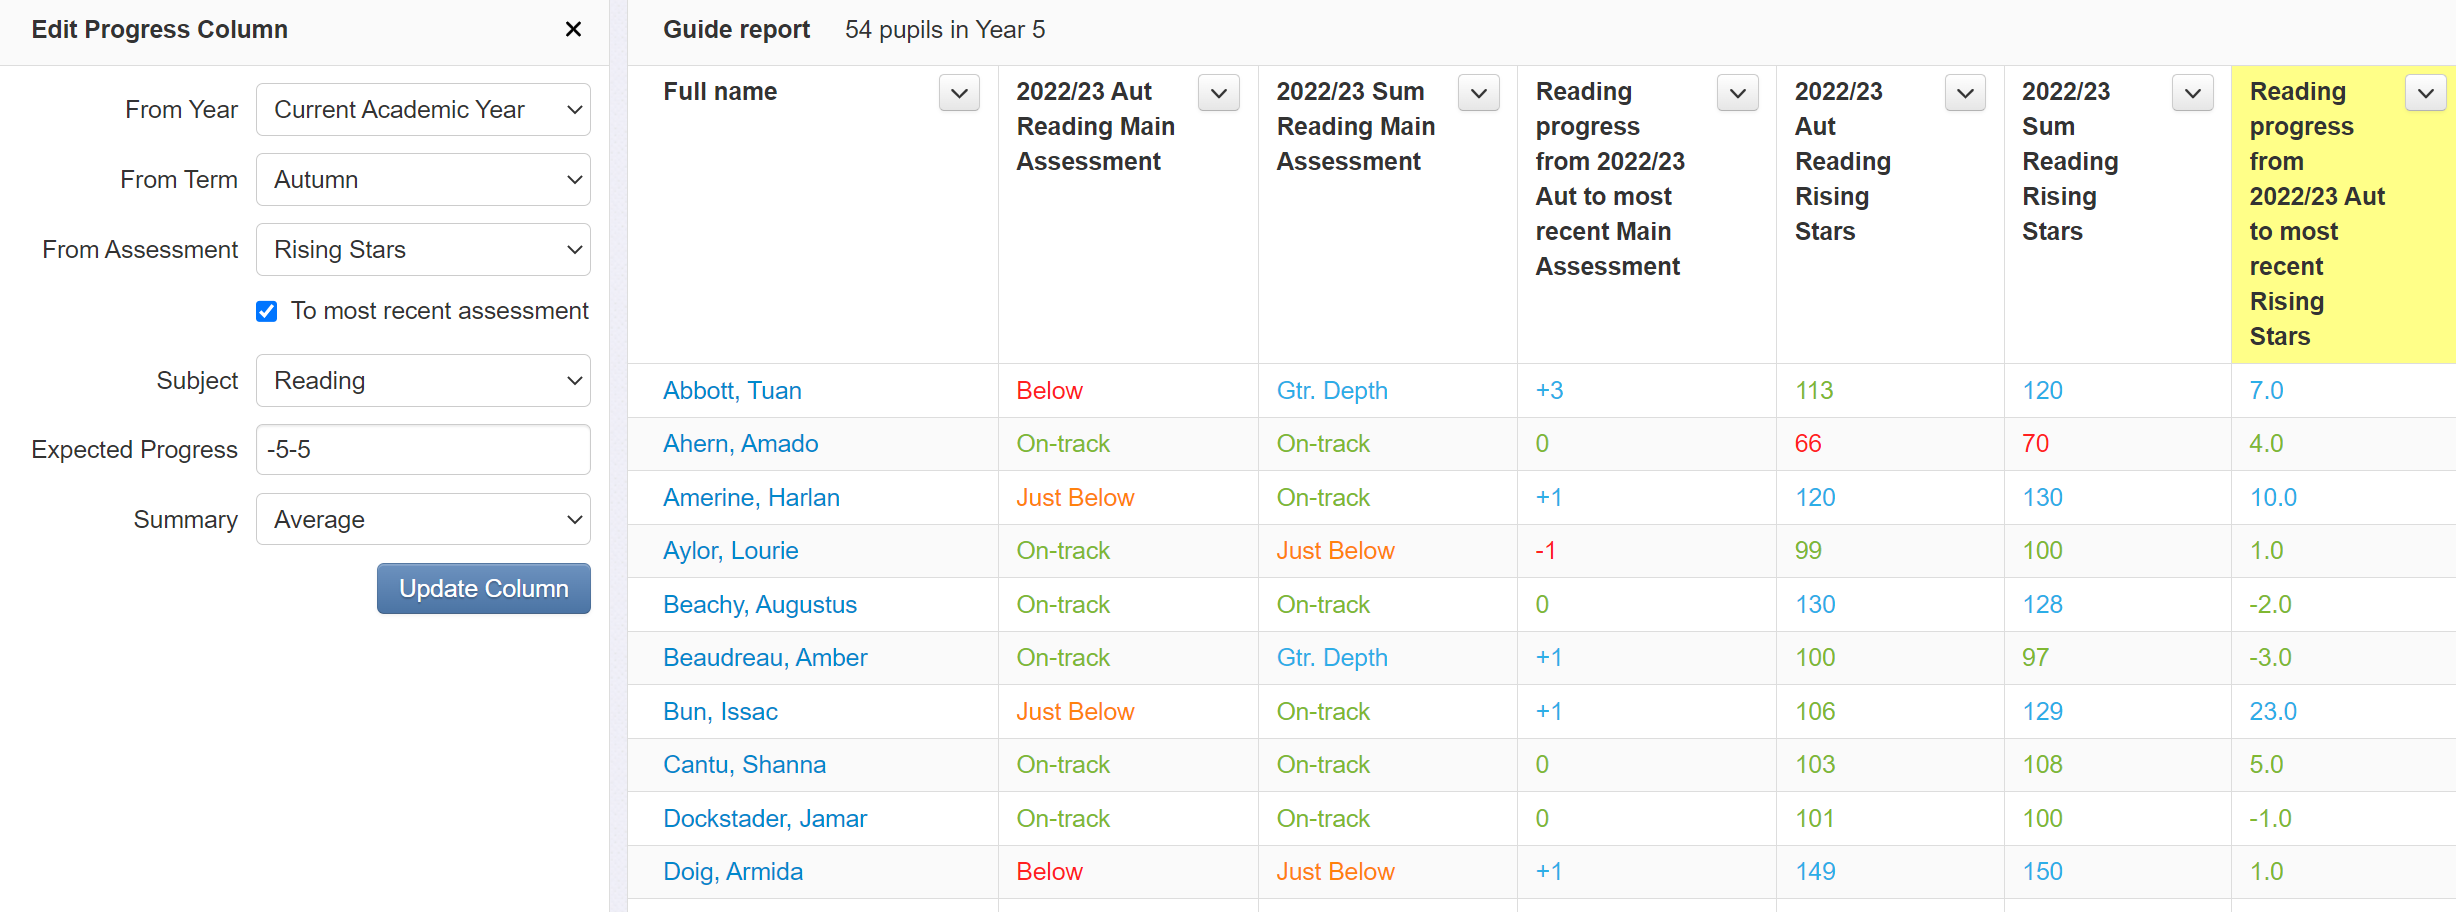 Source: Insight - A Tables Report showing pupil progress between assessments.
What is the Tables report?
Think of Tables as a way to bring different pieces of pupil data together in one place.
We know that when you're making judgements about how a pupil is getting on, there's often a lot of information to consider. Assessment results, attendance, previous performance and plenty more. The trouble is, that information isn't always easy to see together.
That's what we love about Tables.
You can build your own table, choosing exactly which information you'd like to see. From attainment and progress across different subjects and academic years to attendance, SEND provision and pupil characteristics, you can bring it all together in one place. This is customisation at its finest.
It doesn't stop there, though. You can also filter and group pupils, compare results and, if you've created something particularly useful, save your table to come back to again and again.
What can I use the Tables report for?
1. Spot changes in pupil progress
Want to see how pupils have performed between two points in time?
You can add a Progress column to your table, showing the difference between two assessment scores. For example, you might have a column for Autumn results, another for Summer and a third showing how much each pupil's score has changed.
But here's where it gets interesting.
We know that pupils aren't necessarily going to achieve exactly the same score every time they take a test, nor would we expect them to. A small change in either direction doesn't always tell us very much.
That's why you can set your own expected range of progress. For example, you might decide that a change of between -5 and +5 points is within the range you'd expect. Insight will then use colour coding to highlight results that fall within or outside that range.
This gives you some tolerance for normal fluctuations, while making it much easier to spot pupils whose scores have increased or decreased more than expected.
2. Take the hard work out of governors' reports
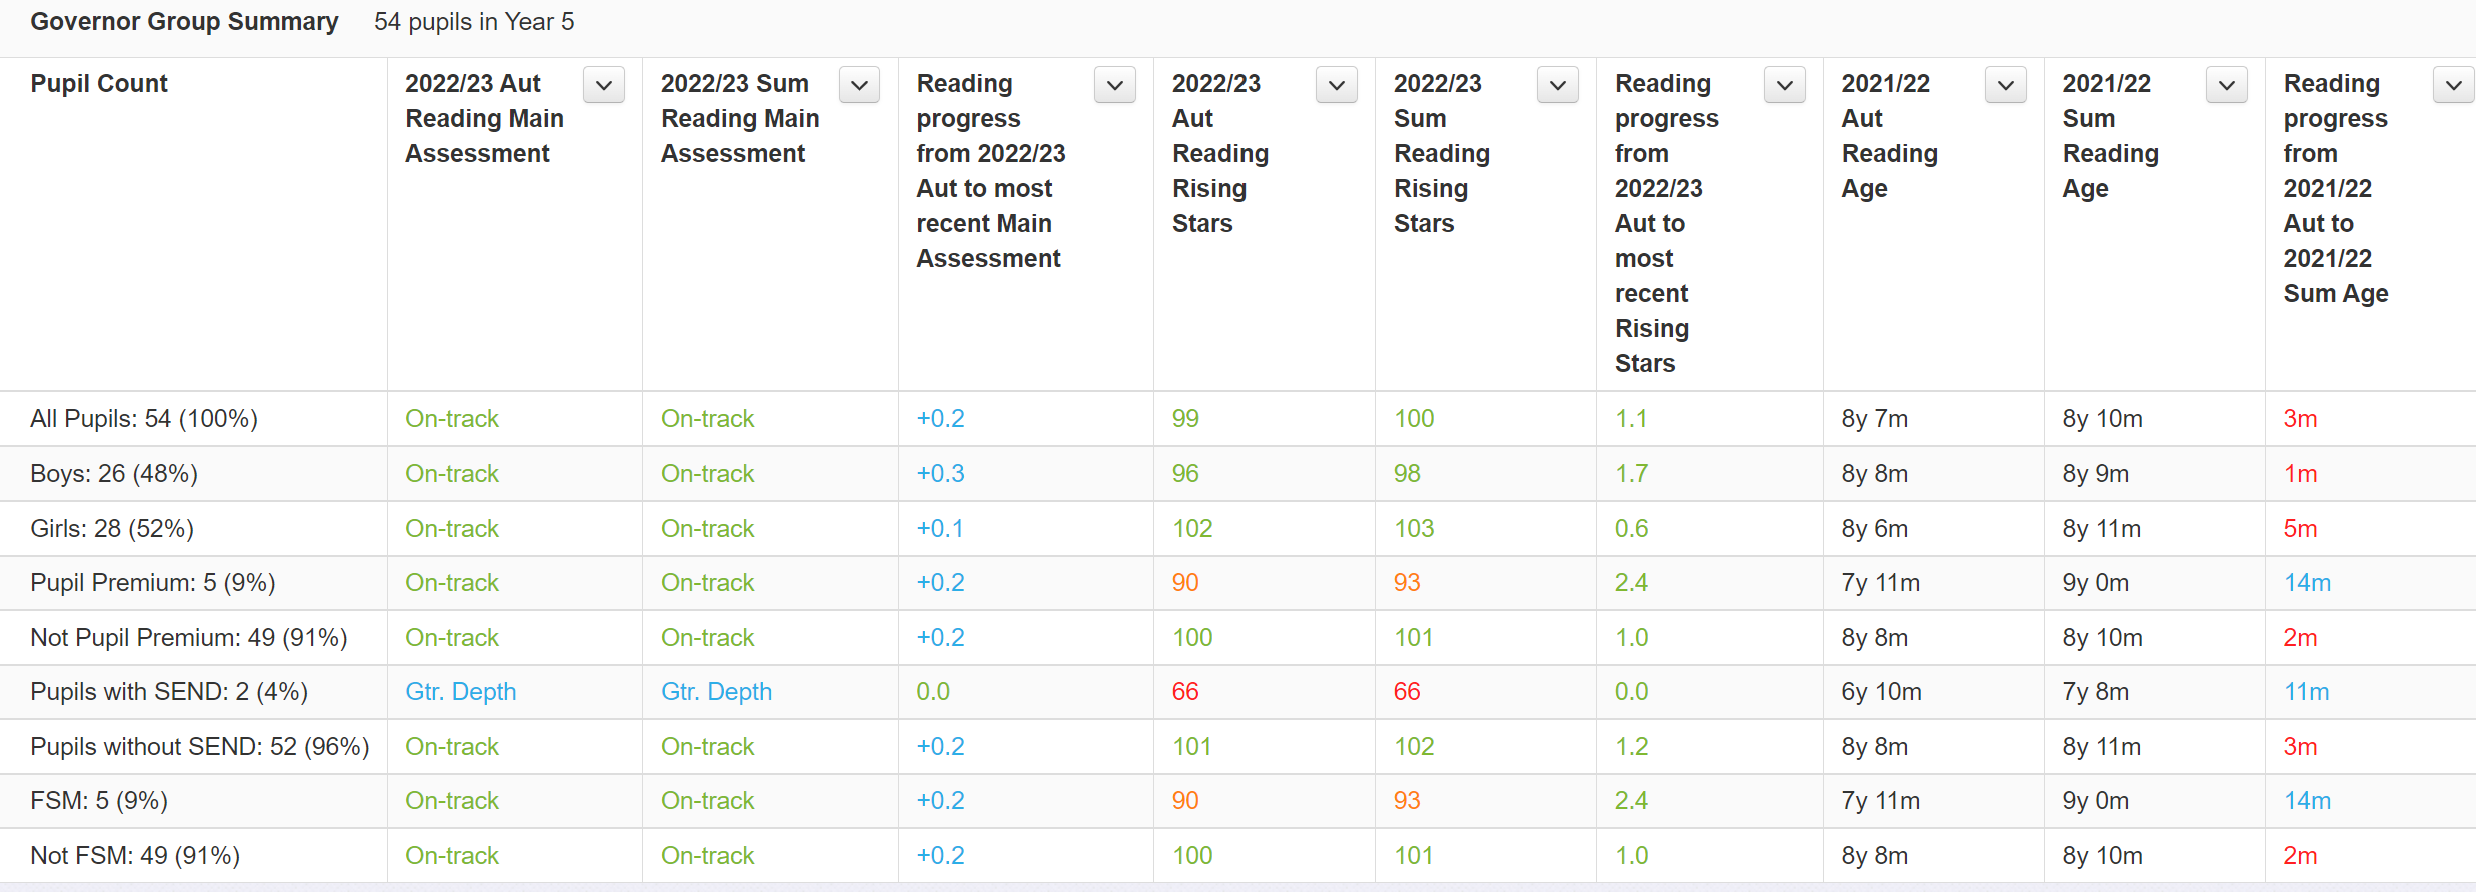 Source: Insight - A Governor Group Progress Summary.
Got a governors' meeting coming up? Chances are, you'll want to share some assessment data, but probably not the names and results of individual pupils.
You could export everything to Excel and spend time putting together your own summaries. Or you could let Insight do the hard work for you.
In Tables, simply select 'Show summary rows, but hide pupil rows' to see summary figures without the individual pupil details.
Want to compare how different groups are performing? You can group pupils by characteristics such as disadvantage, gender or SEND provision, and instantly see the figures for each group.
3. Look beyond the latest assessment results
We know that assessment results don't tell you everything about a pupil, particularly when you're only looking at a single academic year.
Perhaps you're taking on a new class and want to see how pupils have performed in previous years. Or you're a SENCo reviewing a pupil's needs and want to understand what support they've received alongside their assessment history.
With Tables, you can bring together results from different subjects and academic years, alongside attendance, SEND provision and other pupil information.
You can see how their results have changed over time, whether attendance might be worth exploring and what other factors you might want to consider.
Ready to give Tables a try?
Hopefully, we've given you a few ideas for what you could do with Tables. We've only just scratched the surface, but you can find more information in our help guides. We recommend starting here: Tables report - Introduction - Insight Help Guides.
Who knows, it might become one of your favourite Insight reports too!
Get in touch
Insight offers a 60-day, no obligation, free trial. This includes a fully featured system and full support to help you get started. Import your pupils, historic data, and evaluate the system with your team.